


Forum Geografi, 32(2), 2018; DOI: 10.23917/forgeo.v32i2.6662
Refining Suitability Modelling for Sea Cucumber (Holothuria scabra) Using Fully Raster-Based Data
1 Faculty of Agriculture, University of Bengkulu, Kandang Limun, Bengkulu, Indonesia
2 Faculty of Agriculture, University of Dr Soetomo, Semolowaru, Surabaya, Indonesia
3 Faculty of Geography, University of Gadjah Mada, Bulaksumur, Yogyakarta, Indonesia
*) Corresponding Author (e-mail: bambangsulistyounib@gmail.com or bsulistyo@unib.ac.id)
Received: 17 August 2018 / Accepted: 15 November 2018 / Published: 23 November 2018
Abstract
Geographical Information System (GIS) modelling using vector data is a commonly used method of modelling offering simple data input and analysis. However, the vector-data model assumes homogeneity in mapping units based on subjectively applied classification and simplification, and this may lead to over-simplification and consequent reduction in the variety of information obtained and uncertainty in the results. This research aimed at refining the suitability modelling for sea cucumber (Holothuria scabra) using fully raster-based data for the waters of Kiowa Bay, Kahyapu village in the district of Enggano, North Bengkulu, Indonesia. Using a GIS, all parameters affecting suitability for sea cucumber were rasterised to improve compatibility. The relevant data includes nine parameters of sea water namely acidity, depth, current velocity, temperature, salinity, brightness, dissolved oxygen concentration, the condition of the sea floor, and coastal protection of the area. These parameters were surveyed in the field at 51 stations, and each parameter was then digitised and interpolated (using Kriging method) to create a continuous raster-dataset. Correlation analysis was then conducted to check the parameter correlation. Parameters with a correlation coefficient of > 0.75 led to a decision of exclusion for further analysis since these could be derived from the remaining parameter set. Principal component analysis (PCA) was then applied to ascertain the weight of each component. Furthermore, scree plot was employed to choose which principal components were relevant for insertion into the formula of suitability. The final result was then compared to the map of suitability from the analysis of vector-based data as the reference data set. The research results showed that this method can be used to locate areas that are suitable for sea cucumber farming. The suitability map for sea cucumber generated from the analysis using fully raster-based data displayed less uncertainty than the suitability map generated using vector-based data.
Keywords: fully raster-based, GIS, sea cucumber, suitability modeling
Abstrak
Pemodelan Sistem Informasi Geografis (SIG) menggunakan data vektor adalah metode pemodelan yang umum digunakan yang menawarkan input dan analisis data sederhana. Namun, model vektor-data mengasumsikan homogenitas dalam unit pemetaan berdasarkan klasifikasi dan penyederhanaan yang diterapkan secara subyektif, dan ini dapat menyebabkan penyederhanaan yang berlebihan, pengurangan konsekuensi dalam variasi informasi yang diperoleh dan ketidakpastian dalam hasil. Penelitian ini bertujuan untuk menyempurnakan pemodelan kecocokan untuk teripang (Holothuria scabra) menggunakan data berbasis raster untuk perairan Teluk Kiowa, Kabupaten Enggano, Bengkulu Utara, Indonesia. Semua parameter yang mempengaruhi kesesuaian untuk teripang dipertimbangkan menggunakan SIG. Data yang tersedia dikonversi ke format raster untuk meningkatkan kompatibilitas dan analisis. Data yang relevan terkait dengan sembilan parameter air laut meliputi keasaman, kedalaman, kecepatan arus, suhu, salinitas, kecerahan, konsentrasi oksigen terlarut, kondisi dasar laut, dan perlindungan wilayah pesisir. Sembilan parameter ini disurvei di lapangan pada 51 stasiun dan setiap parameter kemudian dipetakan dan diinterpolasi untuk membuat dataset raster, menggunakan interpolasi Kriging. Analisis korelasi kemudian dilakukan untuk memeriksa korelasi parameter. Parameter dengan koefisien korelasi> 0,75 dikeluarkan dari analisis lebih lanjut karena hasilnya dapat diturunkan dari set parameter yang tersisa. Analisis komponen utama (PCA) kemudian diterapkan untuk memastikan bobot masing-masing komponen. Selanjutnya, plot scree digunakan untuk memilih komponen utama mana yang relevan untuk dimasukkan ke dalam formula kesesuaian. Hasil akhir kemudian dibandingkan dengan peta kesesuaian dari analisis data berbasis vektor sebagai set data referensi. Hasil penelitian menunjukkan bahwa metode ini dapat digunakan untuk menemukan area yang sesuai untuk mengembangkan teripang. Peta kesesuaian untuk teripang yang dihasilkan dari analisis menggunakan data yang sepenuhnya berbasis raster menampilkan lebih sedikit ketidakpastian daripada peta kesesuaian yang dihasilkan menggunakan data berbasis vektor.
Kata kunci: berbasis raster penuh, SIG, teripang, pemodelan kesesuian
1. Introduction
Natural resource management, particularly the management of marine resources, requires careful planning (Sulistyo, 2017). In considering the management of sea cucumber (Holothuria scabra), a map of suitability for its farming is required, generated from comprehensive and integrated survey data. However, the gathering of such data is time-consuming and expensive (Sulistyo, 2016) and suitability mapping for the farming of sea cucumber has therefore been generated from predictions or models based on the parameters that affect their development.
The development of a model must be carried out by experts in the relevant field of study. According to Turban and Aronson (2007), a model is a form of simplified representation or abstraction of reality that can be used to address problems found in the real world that are complex and difficult to predict. Representations of systems or problems through modelling can be based on the level of abstraction and can be classified into three groups: iconic, analogue and mathematical.
A model is a subjective approach that, while it does not include all possible observations or measurements, retains important aspects of the real-world situation. A good model is one with a high probability of accuracy if applied in a variety of conditions. However, the model will require refinement if new information is obtained that relates to reality. In modelling, there is often a tendency to make the model too complicated, on the assumption that a complicated model is a good model. There are many possible models of environmental systems, but there is no definition or term that is entirely appropriate to describe the types of available model (Aral, 2010).
For the purposes of planning and management of natural resources, modellers generally choose a mathematical model in which the dependent variable is defined as a mathematical operation on a set of independent variables. With the development of GIS, modellers can perform data entry, data management, data analysis and presentation of results more easily, because model modification can be performed more quickly than in the past. In GIS modelling, multiple analytical approaches can be established to evaluate various scenarios of site suitability. These approaches enable alternative development strategies to be examined and compared before making final decisions or commitments (Chekuimo, 2008; ESRI, 2010).
In general, modelling related to the determination of suitability in an area is defined as Equating 1 (Eastman, 2006; Song and Kang, 2016). In this equation S is the suitability, w is the weight of factor i, and x is the potential rating of factor i. The analysis of suitability for the cultivation of sea cucumber involves nine factors or parameters: seawater acidity, depth, current velocity, temperature, salinity, brightness, dissolved oxygen concentration, the condition of the sea floor, and coastal protection of the area.
S = Σ wixi (1)
There are several methods of weighting, including ranking, rating, and pairwise comparison (Malczewski, 1999; Zardari et al., 2015; Song and Kang, 2016). The ranking is a simple method developed with weights classified into particular levels. The criteria and weighting are based on the considerations of the decision maker. In contrast, rating arranges factors by percentile; factors with the lowest percentage values are the least important, and factors with the highest percentages are the most important. Pairwise comparison is used in the analytical hierarchy process (AHP). This method determines the relative weightings between two criteria based on a scale of weight values from 1 to 9. As in ranking and rating, AHP weights are also expressed in numerical weights totalling one. In AHP, weightings are determined after establishing eigenvalues, indicating the relative importance of factors or components. The higher the weight of an attribute, the more relevant it is for consideration.
Similarly to the determination of weights using AHP, principal component analysis (PCA)is a statistical analysis method that can also be used in weighting. It has been shown that spatially weighted PCA provides a new way of implementing PCA with constraints on samples according to their spatial properties about the objective of the study. The definition and construction of weighting functions are flexible depending upon the properties of samples.
In general, weighting performed for qualitative data is subjective, even if it is carried out by an expert (expertise judgment). Likewise, in the analysis conducted with the help of GIS, most data used have been simplified or reclassified prior to overlay analysis to aid input of the weighting data. In other words, if those data are presented as a digital map they are in the form of vectors. In the vector-data model, objects in the real world are represented by the points and lines that define their boundaries. Its placement defines the position of each object in a map space that is organised by a coordinate reference system. Every position in the map space has a unique coordinate value. Points, lines, and polygons are used to represent irregularly distributed geographic objects in the real world (Chang, 2008).
DeMers (2008) states that the presentation of earth information in vector-data models assumes the existence of homogeneity in the mapping unit. The mapping unit of the vector model as a representation of the real world has characteristics of homogeneity, classification and simplification. These processes are carried out subjectively and so that there is the possibility of over-simplification and consequent reduction in detail. Thus the results of such analysis are uncertain.
With technological advances in remote sensing and GIS, these uncertainties can be minimised by applying fully raster-based suitability modelling that can be conducted objectively using established algorithms and mathematical formulas with less simplification (Hadmoko, 2007). Fully raster-based suitability modelling uses data in raster format, rather than in raster format as a result of vector-to-raster conversion algorithms (Sulistyo et al., 2011). In the raster-data model, space is regularly subdivided into cells (usually square in shape). The location of geographic objects is defined by the row and column with a geographic reference. The area that each cell represents defines the spatial resolution available. The value stored for each cell indicates the type of object that is found at that location. Thus in the raster approach, the space is populated by a large number of regularly distributed cells, each of which can have a different value. Satellite imagery and digital elevation model are examples of data presented in raster format (Chang, 2008). There are data inputs into GIS which are already in raster format, while other data acquire raster format through spatial interpolation available in almost all GIS software. Spatial interpolation is the process of using points with known values to estimate values at other points (Chang, 2008). Using fully raster-based data, Sulistyo (2011) successfully remodelled the level of degraded land in Indonesia.
The uncertainties of the results of the spatial analysis are found from the previous study of suitability analysis using vector-based approach. Therefore we propose to address this by applying fully raster-based approach. Wulandari et al. (2016) performed an analysis of sea cucumber suitability modelling using vector-based data in the waters of Kiowa Bay, Kahyapu village, in the district of Enggano. The results showed that the study area contained 102,477 hectares highly suitable for cultivating sea cucumber, 62,435 hectares suitable for cultivation, and 197,991 hectares not suitable for cultivation. This suitability map is the result of analysis using vector-based data and is therefore simplified and consequently uncertain. For example, if one wants to develop the cultivation of sea cucumber using pen-culture techniques with a pen size of 20 meters by 20 meters, there will be uncertainty about where the best location will be (regarding position and coordinates). This research aimed to refine the suitability modelling for sea cucumber (Holothuria scabra) by using fully raster-based data for the same area.
2. Methods
2.1 Study Area
Kiowa Bay is located between longitudes of 102.24o and 102.37o east and between latitudes of 5.45o and 5.47o south. The study area was approximately 362 hectares (see Figure 1). Wulandari et al. (2016) analysed suitability for the cultivation of sea cucumbers using vector-based data in this area which contain uncertainties. The result was refined using fully raster-based data using the previously collected data.
Figure 1. Location of the research in Enggano Island in the district of North Bengkulu, Bengkulu Province, Indonesia.
2.2 Data and Analysis
This research validates the result of the raster-based suitability analysis of sea cucumber farming with the previous study which was conducted by the vector-based approach (Wulandari et al., 2016). The complete flow diagram of the study is presented in Figure 2 where the presentation of this study focuses on the analysis using raster-based data. Meanwhile, the analysis using vector-based data can be found elsewhere (Wulandari et al., 2016).
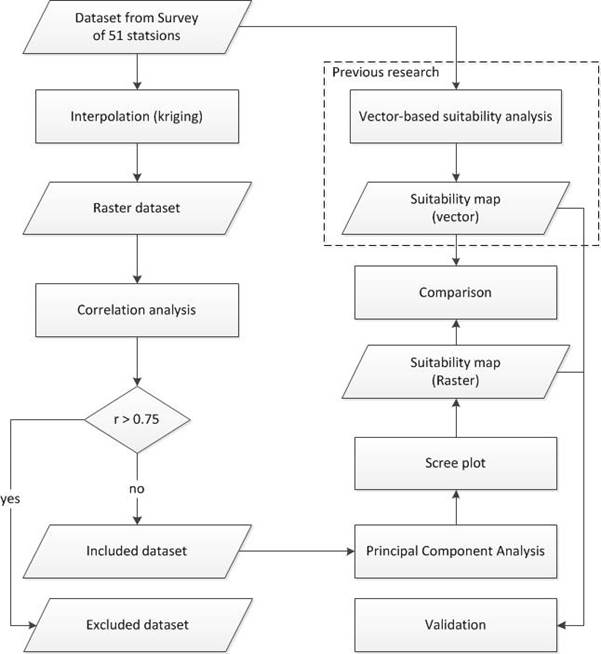
Figure 2. Flow diagram of the study.
Two GIS software packages were used to analyse and handle data including Integrated Land and Water Information System (ILWIS) version 3.7 and ArcView version 3.5. Meanwhile, some hardware was also required, namely a drafting tablet, equipment for field work including a small boat, binoculars, compass, current meter, refractometer, Secchi disk, Tetra Test Kit O2, pH meter, rope, pipe, tide gauge, Global Positioning System (GPS), and digital camera.
Fifty-one stations were randomly determined at any point where the boat was temporarily stopped, with the assumption that the more points are taken, the better the results of the interpolation. Measurements of the chemical and physical parameters of seawater were taken between 10:00 and 17:00, with three repetitions for each parameter for each station. The parameters were related to the seawater characteristics of acidity, depth, current velocity, temperature, salinity, brightness, dissolved oxygen concentration, the condition of the sea floor, and coastal protection of the area. Geographic coordinates and all parameters at each station were recorded on previously prepared forms.
Each parameter was then digitised and interpolated to create a continuous raster-data set using Kriging interpolation and nine thematic raster-based maps were produced. Kriging interpolation was used for the analysis because it had been successfully applied by Sulistyo (2011; 2015) and Sulistyo et al. (2009; 2017) to interpolate the value of erodibility as an input in determining erosion hazard and to remodel degraded land in Merawu Catchment, Banjarnegara, Central Java. A good accuracy was achieved using only 30 unevenly distributed samples. Thus, applying the Kriging interpolation technique for this study of 51 evenly distributed samples was deemed to be appropriate. The pixel size chosen for the study was 10 meters by 10 meters. Fauzi et al. (2014) also used Kriging to model the run-up tsunami in Bengkulu since it has high accuracy.
In relation to raster-based sea cucumber suitability modelling, the spatial information or pixel value for each pixel was derived from the (above) analyses. These pixel values for each parameter of sea cucumber suitability could then be viewed as pixel values for each band or channel in the remote sensing digital images.
Remote sensing digital images were analysed via multi-band statistics. One of these is a correlation analysis of the closeness of the information for one band to the other bands (ILWIS User’s Guide, 2002; Cheng et al., 2006; Lillesand et al., 2008). The individual bands of a multi-spectral image are often highly correlated, which implies that there is a redundancy in the data and information is being repeated. A correlation matrix can be used to evaluate the degree of correlation between the individual bands. This matrix (a normalised form of the covariance matrix) has values in the range of -1 to 1, representing a strong negative correlation to a strong positive correlation respectively, where values close to zero represent little correlation. Bands can be selected that show the least correlation using the correlation coefficients of the matrix and therefore the most significant amount of image variation/information to be included in a multi-band composite, prior to a supervised multi-spectral classification analysis.
By analogy to the analysis of remote sensing digital images, this research also used correlation analysis to check the correlation among the parameters of sea cucumber suitability. Parameters with a correlation coefficient of > 0.75 (classified as “high” by Sarwono (2006)) were excluded from further analysis since they can be derived from the remaining parameter set; thus, the model only used parameters having the least correlation.
PCA was then applied to weight each component. Furthermore, scree plotting was employed to choose which principal components were relevant for insertion into the formula of suitability. The final result was then compared to the map of suitability from the analysis of vector-based data as the reference data set.
3. Results and Discussion
Nine thematic raster-based maps, derived from spatial interpolation using Kriging, are presented in Figures 3a to 3i. The distribution of the 51 stations used in the study is also presented. Each figure contains a legend of parameter weighting. The distribution of each parameter can be seen directly on each map. The results of the correlation analysis are presented in Table 1.
Figure 3. The maps of sea waters parameter produced by kriging spatial interpolation. (a) sea brightness - SB, (b) depth of sea floor - SF, (c) sea current - SC, (d) dissolved of oxygen - DO, (e) condition of sea floor - FC, (f) sea acidity - SA, (g) coastal protection area - PA, (h) sea salinity - SS, (i) sea temperature - ST.
Table 1. Results of correlation analysis among parameters.
|
|
SC |
SB |
SF |
FC |
PA |
DO |
SA |
SS |
ST |
|
Current (SC) |
1.00 |
0.02 |
-0.01 |
-0.15 |
-0.01 |
0.12 |
0.11 |
0.05 |
0.00 |
|
Brightness (SB) |
0.02 |
1.00 |
-0.34 |
0.40 |
-0.60 |
-0.15 |
0.28 |
0.92 |
0.32 |
|
Depth (SF) |
-0.01 |
-0.34 |
1.00 |
0.55 |
0.38 |
0.39 |
-0.70 |
-0.34 |
-0.56 |
|
Sea floor condition (FC) |
-0.15 |
0.40 |
0.55 |
1.00 |
-0.20 |
0.06 |
-0.36 |
0.36 |
-0.20 |
|
Protection (PA) |
-0.01 |
-0.60 |
0.38 |
-0.20 |
1.00 |
0.36 |
-0.58 |
-0.72 |
-0.42 |
|
Dissolved oxygen (DO) |
0.12 |
-0.15 |
0.39 |
0.06 |
0.36 |
1.00 |
-0.44 |
-0.17 |
-0.66 |
|
Acidity (SA) |
0.11 |
0.28 |
-0.70 |
-0.36 |
-0.58 |
-0.44 |
1.00 |
0.37 |
0.54 |
|
Salinity (SS) |
0.05 |
0.92 |
-0.34 |
0.36 |
-0.72 |
-0.17 |
0.37 |
1.00 |
0.35 |
|
Temperature (ST) |
0.00 |
0.32 |
-0.56 |
-0.20 |
-0.42 |
-0.66 |
0.54 |
0.35 |
1.00 |
As seen from Table 1, all parameters had correlation coefficients of < 0.75, except for that of salinity and brightness (r = 0.92). As mentioned earlier, parameters with a correlation coefficient > 0.75 were excluded from further analysis since they could be derived from the remaining parameter set, so the model only used the parameters with the least correlation.
The brightness of seawater can be affected by the influx of water from the river estuary carrying sediment. The sediment will cause a rise in sea temperature which affects the speed of chemical reactions and thus affects salinity. With limited osmotic adjustment ability, sea cucumber cannot survive drastic changes in salinity. In this case, the salinity factor was more important for consideration as an input for the creation of a map of suitability for sea cucumber than the brightness of seawater (Helfman et al., 2009; Søgaard, 2014).
From the nine parameters previously defined, therefore, only eight parameters should be kept for further analysis. The result of PCA is presented in Table 2, while its scree plot is presented in Figure 4. The scree plot (Figure 4) shows that only four principal components (PCs) have significant values, and these were chosen for the final formula of suitability. The total percentage of these four PCs was 88.26% (see Table 2), meaning that they comprised the majority of the variance, with the remainder representing only 11.74%.
Table 2. PCA results.
|
|
SC |
SB |
SF |
SC |
PA |
DO |
SA |
SS |
Variance % |
Cummu-lative % |
|
PC_1 |
0.009 |
-0.442 |
-0.126 |
-0.426 |
-0.324 |
0.382 |
0.337 |
0.494 |
46.2 |
|
|
PC_2 |
-0.030 |
0.301 |
0.705 |
-0.399 |
0.041 |
-0.112 |
0.476 |
-0.105 |
24.69 |
70.89 |
|
PC_3 |
-0.131 |
0.297 |
0.280 |
0.231 |
-0.611 |
-0.207 |
-0.302 |
0.505 |
11.73 |
82.62 |
|
PC_4 |
-0.069 |
0.202 |
-0.041 |
-0.470 |
-0.390 |
0.384 |
-0.448 |
-0.481 |
5.64 |
88.26 |
|
PC_5 |
0.653 |
0.518 |
-0.149 |
-0.180 |
0.264 |
0.194 |
-0.115 |
0.361 |
4.36 |
92.62 |
|
PC_6 |
-0.661 |
0.173 |
-0.126 |
-0.361 |
0.455 |
-0.064 |
-0.247 |
0.339 |
3.14 |
95.76 |
|
PC_7 |
-0.153 |
-0.017 |
0.415 |
0.414 |
0.225 |
0.753 |
-0.091 |
0.078 |
2.61 |
98.37 |
|
PC_8 |
-0.301 |
0.535 |
-0.443 |
0.226 |
-0.199 |
0.205 |
0.535 |
-0.088 |
1.63 |
100.00 |
Figure 4. Scree plot for PCA results.
As the sum of the percentage of chosen PCs did not reach 1 (or 100%), it was multiplied by a factor of 1.13302 (100 divided by 88.26) giving weights of 0.5235, 0.2797, 0.1329 and 0.0639 for PC_1, PC_2, PC_3 and PC_4, respectively. Finally, applying Equation 1, the suitability for sea cucumber was formulated as Equation 2. The application of Equation 2 resulted in suitability values ranging from 0.0 to 3.89, with the lowest value indicating the most suitable location for cultivating sea cucumber. The suitability map resulting from the analysis using raster-based data (for further discussion, this is referred to as the Suitability Raster) is presented in Figure 5, while Figure 6 presents a histogram showing the number of pixels for each suitability value. From the number of pixels, the area can be calculated by multiplying by the pixel size of 10 meters by 10 meters. As an example, if the number of pixels for a certain suitability value is 23, the area is 2,300 m2.
Suitability = 0.5235 * PC_1 + 0.2797 * PC_2 + 0.1329 * PC_3 + 0.0639 * PC_4 (2)
Figure 5. Raster-based map of suitability for sea cucumber.
Figure 6. Histogram showing the number of pixels and the value of suitability.
These maps were overlaid for the comparison analysis between the Suitability Raster and the Suitability Vector (the result of suitability analysis using the vector-based data), as presented in Figure 7 (the yellow line represents the suitability boundary of the Suitability Vector). Figures 5 and 7 indicate that for the Suitability Raster, the area which is most suitable for the development of sea cucumber aquaculture lies in the north-western part of the study area, shown in dark blue. Its location is directly adjacent to the shoreline at a distance of between 200 and 600 meters from the shoreline, and this is much more accessible than the location of the most suitable area of the Suitability Vector. These results seem more reasonable than those of the Suitability Vector analysis. Furthermore, a suitable location in the Suitability Raster is located far from the open sea, protecting sea cucumbers from the instability of marine conditions in the study area of Kiowa Bay.
Figure 7. Vector-based map of the suitability of sea cucumber overlaid on the raster-based map.
Furthermore, the Suitability Raster areas with lower degrees of suitability indicated gradually by cyan, yellow, reddish yellow and pink, are located in the part of the study area most distant from the shore. For areas that are far from the shoreline, both maps of suitability (Suitability Vector and Suitability Raster) gave similar results, namely the suitability value was “high” in the Suitability Raster and “not suitable” in the Suitability Vector.
Another advantage of the Suitability Raster is in determining the installation location of pen-culture nets in the field. For example, if a pen-culture net with a size of 20 meters by 20 meters (400 m2) was to be installed, the exact location could be easily determined from the Suitability Raster by selecting four adjacent pixels (according to the pixel size previously defined of 100 m2), so that the coordinates could be determined easily and precisely. However, this cannot be done using the Suitability Vector, in which the locating of pen-culture nets with an area of 400 m2 is difficult to determine. In other words, the Suitability Vector has a high level of uncertainty compared with the Suitability Raster in determining exact locations. Furthermore, the Suitability Raster has a higher degree of confidence, because its data inputs are more original than those of the Suitability Vector, in which data input is simplified causing simplification causing the variation of earth information is reduced (DeMers, 2008).
However, both the Suitability Raster and the Suitability Vector are the result of models that must be validated to justify which is the most appropriate, because a model is a subjective approach that does not include all observations, but retains important aspects of reality which remains visible. Creation of a model still requires refinement if new information that relates to reality is acquired. These models have to be validated by installing pen-culture nets at different locations (and for different suitability classes) and raising sea cucumbers to observe their growth parameters directly.
4. Conclusion
The research results show that to locate a certain area for developing pen-culture nets in the field, the suitability map for sea cucumber generated from the analysis using fully raster-based data has less uncertainty than the suitability map generated using vector-based data. However, for better justification, these models need to be validated by installing pen-culture nets at different locations (and for different suitability classes) for raising sea cucumbers to observe their growth parameters directly.
Acknowledgement
The authors would like to thank the Chairman of the Institute of Research and Community Service, University of Bengkulu, for facilitating funding and administration for this research. Thanks also to Veronika Marpaung and Randy Hermawan, alumni of the Department of Marine Sciences, Faculty of Agriculture, University of Bengkulu, for assisting us when collecting data at Kiowa Bay.
References
Aral, M., (2010). Environmental modelling and health risk analysis (Act/Risks), Business Media BV, Springer Science, London.
Chang, K.T., (2008). Introduction to geographic information systems, McGraw-Hill International Edition, New York, USA.
Chekuimo, G.H., (2008). Integrating ecological tools with geographic information systems, The International Archives of the Photogrammetry, Remote Sensing and Spatial Information Sciences, Vol. XXXVII. Part B4. Beijing: 73-78.
Cheng, Q., Jing L., Panahi A., (2006). Principal component analysis with optimum order sample correlation coefficient for image enhancement, International Journal of Remote Sensing, vol. 27: 3387-3401.
DeMers, M.N., (2008). Fundamental of geographic information systems, John Wiley & Sons, New York.
Eastman, R.J., (2006). Idrisi Andes: Guide to GIS and image processing, Clark Labs, Clark University, Worcester, USA.
ESRI, (2010). GIS Best Practices: Environmental management, Redlands, USA.
Fauzi, Y., Suwarsono, and Mayasari, Z. M., (2014). The Run up Tsunami Modeling in Bengkulu using the Spatial Interpolation of Kriging Technique, Forum Geografi, Vol. 28, No. 2, December 2014: 103 – 112.
Hadmoko, D.S., (2007). Toward GIS-based integrated landslide hazard assessment: a critical overview, The Indonesian Journal of Geography, vol. 39: 87-95.
Helfman, G.S., Collette, B.B., Facey, D.E., and Bowen, B.W., (2009). The Diversity of fishes: biology, evolution, and ecology, Wiley-Blackwell Publishing, West Sussex, UK.
Ilwis User’s Guide, (2002). ITC, Enschede, The Netherlands.
Lillesand, T.M., Kiefer, R.W., and Chipman, J., (2008). Remote sensing and image interpretation (6 ed.), John and Wiley Sons, New York.
Malczewski, J., (1999). GIS and multicriteria decision analysis, John Wiley & Sons, Inc. United States of America.
Sarwono, J., (2006). Quantitative and qualitative research, Graha Ilmu, Yogyakarta [Indonesian].
Søgaard, D.H., (2014). Biological activity and calcium carbonate dynamics in Greenland sea ice – Implication for the inorganic carbon cycle, PhD thesis, Greenland Climate Research Centre and Department of Biology, University of Southern Denmark, Greenland Institute of Natural Resources, 148 pp.
Song, B. and Kang, S., (2016). A Method of assigning weights using a ranking and nonhierarchy comparison, Advances in Decision Sciences, 2016: 1-9.
Sulistyo, B., (2011). Spatially raster-based land degradation modeling using landsat 7 ETM+ and GIS, Dissertation, Faculty of Geography, University of Gadjah Mada, Yogyakarta, Indonesia [Indonesian].
Sulistyo, B., (2015). Pemodelan Faktor K Berbasis Raster Sebagai Masukan Pemodelan Erosi Di DAS Merawu, Banjarnegara, Provinsi Jawa Tengah (Modeling of Raster-Based of K Factor as Input for Erosion Modeling at Merawu Catchment, Banjarnegara, Central Java Province), Jurnal Manusia dan Lingkungan, 22: 240-246.
Sulistyo, B., (2016). The Effect of choosing three different c factor formulae derived from ndvi on a fully raster-based erosion modeling, 2nd International Conference of Indonesian Society for Remote Sensing (ICOIRS), Published under licence by IOP Publishing Ltd, IOP Conference Series: Earth and Environmental Science, Vol. 47, No. 1.
Sulistyo, B., (2017). The accuracy of the outer boundary delineation of coral reef area derived from the analyses of various vegetation indices of satellite landsat thematic mapper, Biodiversitas, vol. 18: 351-358.
Sulistyo, B., Gunawan, T., Hartono, Danoedoro, P., (2009). Toward a fully and absolutely raster-based erosion modeling by using RS and GIS, Indonesian Journal of Geography, vol. 41: 149-170.
Sulistyo, B., Gunawan, T., Hartono, Danoedoro, P., Listyaningrum, N., (2017). Absolute Accuracy of the Erosion Model of DEM-NDVI and it’s Modification, International Journal of Geoinformatics, vol. 13: 23-34
Turban, E., and Aronson, J., (2007). Decision support system and expert systems, 5th Edition, Prentice Hall.
Wulandari, U., Sulistyo, B. and Hartono, D., (2016). The Application of GIS in determining the suitability of sea cucumber (Holothuria Scabra) in Kiowa Bay, Kahyapu Village, District of Enggano, Journal of Enggano, vol. 1: 57-73 [Indonesian].
Zardari, N.H., Ahmed, K., Shirazi, S.M. and Zulkifli, (2015). Weighting methods and their effect on multi-criteria decision making model outcomes in water resources management, Springer, London.
© 2018 by the authors. Submitted for possible open access publication under the terms and conditions of the Creative Commons Attribution (CC-BY-NC-ND) license (http://creativecommons.org/licenses/by/4.0/).
Article Metrics
Abstract view(s): 753 time(s)Refbacks
- There are currently no refbacks.


